Base Reports
Run 61 everyday Fishbowl reports, then filter, total and export them
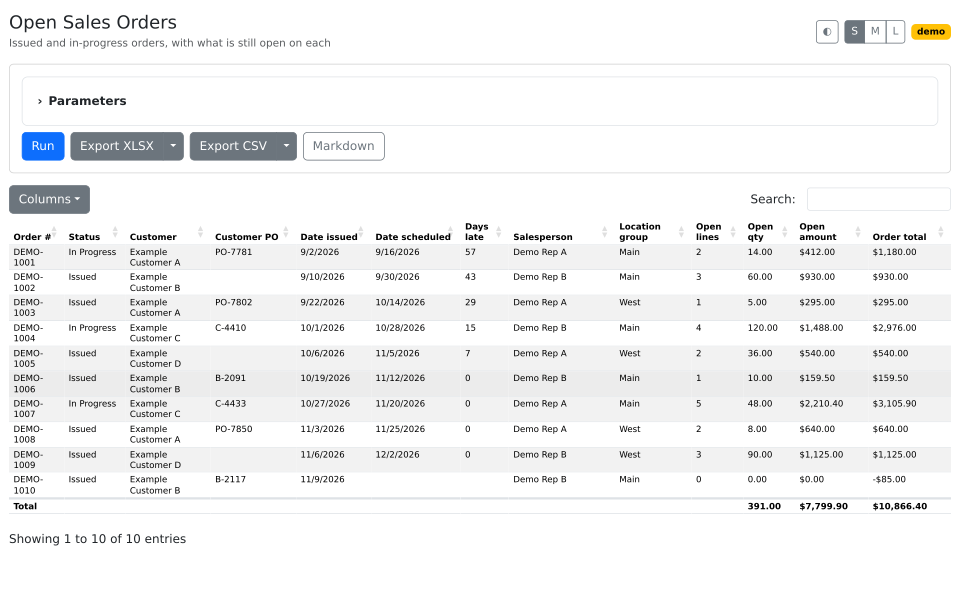
Sales, inventory, purchasing, manufacturing and operations reports that open inside Fishbowl. Each one filters, sorts and exports to Excel, and most add totals and your custom fields, so a question gets answered without a query or a spreadsheet rebuild.
What it's for
The everyday questions are simple: which orders are late, what is short, what sold last month. Answering one means running a report, exporting it, deleting columns, adding a total and filtering again in a spreadsheet. A custom field, such as a region or rep code, gets joined in by hand.
What it does
Opens 61 reports in Fishbowl, in five folders: Sales, Inventory, Purchasing, Manufacturing and Operations.
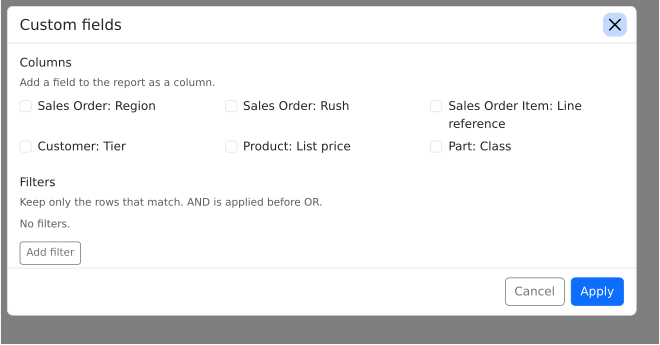
Adds your custom fields. A field from the order, line, customer, product or part becomes a column, or a filter by its type.
Totals and links. Quantity and money columns total under the table. An order, customer, product or part opens that record in Fishbowl.
Exports what it loaded, to XLSX with real dates and numbers and the parameters used, or to CSV.
Use it for
- A morning check. Open Sales Orders and Backorders show what is late and what is short.
- Month end. Sales by Month, Sales by Customer and Sales Margins answer the meeting's questions.
- A buying run. Reorder Report and Inventory Availability show what is low and already on order.
Good to know
An administrator grants each report to the user groups that need it. A user who can open a report sees everything it reads, and seven reports show cost.
The reports read and never write. A report shows only what Fishbowl holds: Reorder Report needs reorder points set, and Work Order Cost needs finished work orders.