Inventory Movement
See where stock moved between your location groups, and how late it was entered
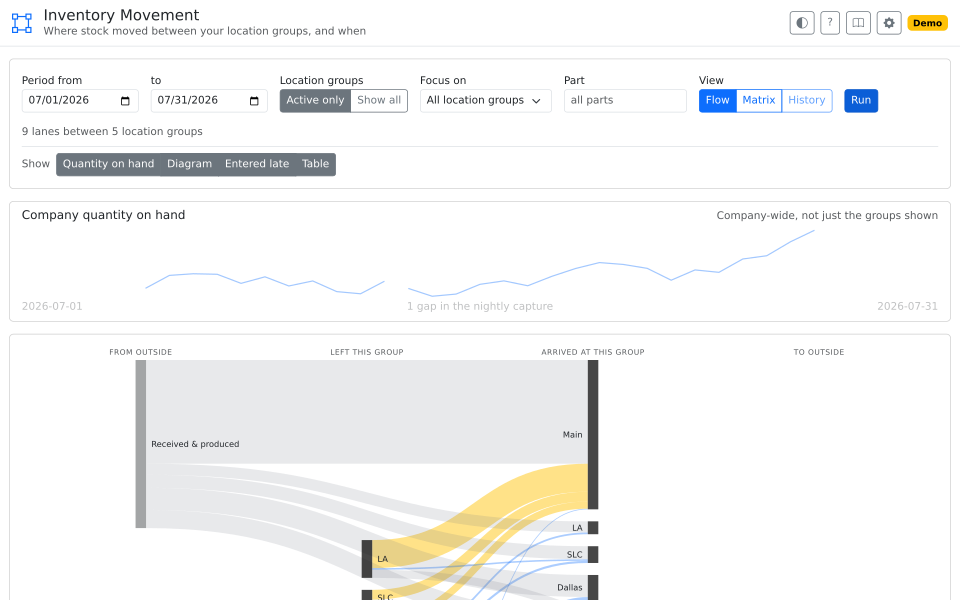
A period's stock movement drawn as a flow between location groups, against the quantity on hand it has to account for.
What it's for
When the stock in a location group does not look right, the question is always the same: what moved, when, and where did it go.
Fishbowl records every movement — each receipt, pick, ship, adjustment, and transfer leg, with its part, quantity, locations, and both the date it happened and the date it was entered. The answer is in there. Reading it is the work: a month is hundreds of events in event order, and the shape has to be held in your head while you scroll.
This page draws the shape instead.
What it does
Draws the period as a flow: every location group a node, every movement between them a band as wide as the quantity that crossed. Receipts enter from outside, shipments leave, and any band opens to the parts behind it.
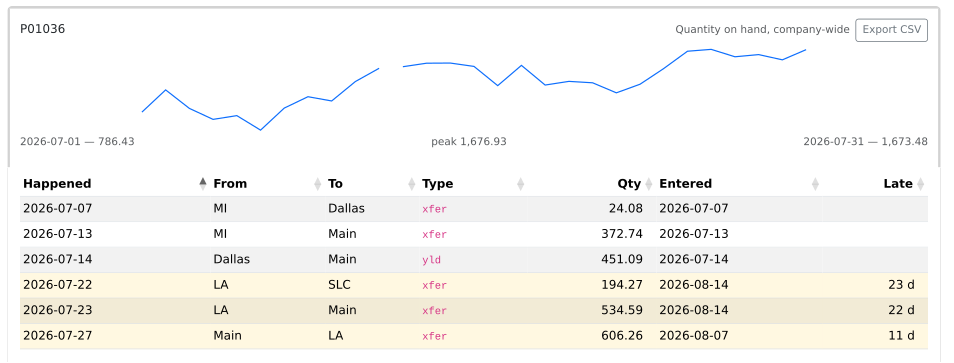
Marks movement entered after the fact — a move dated into the period but keyed in three weeks later is drawn, and named, with how late it was. That is usually why a period does not look right.
Narrows to one location group and those it traded with, or to one part, opening that part's quantity and every move that changed it.
Use it for
Closing a period, when the quantity on hand moved and you have to say what moved it. Investigating a location group that is short, or a transfer that landed as one leg. Finding out how far behind your entry actually is.
Good to know
Quantity, not value. No cost or currency appears anywhere, deliberately: quantity reconstructs exactly from movement, and value does not, because average cost is restated without anything moving.
The quantity line is a company figure, captured per part across the whole company, so it covers every location group while the flows beneath it are per group. Narrow to some groups and the line steps back.
The page reads: it changes no inventory and posts nothing, and opens for anyone who may view inventory.